Free · no sign up · nothing stored
Most blood alcohol calculators give you one flat number and stop there. This BAC test calculator, sometimes called a blood alcohol concentration calculator, goes further. Enter your weight, height, and sex, log the drinks you actually had, and pick the legal limit that applies to you, whether that's a standard US driving limit, a commercial limit, an under-21 zero tolerance rule, or a UK or EU limit. From there, track your blood alcohol content live, see your peak BAC, and know exactly when you'll be under the limit or fully sober. No sign up, nothing sent to a server, completely free.
● 3 calculation models ● State and country legal limits ● Live BAC curve
Used to estimate body water distribution — the biggest factor in BAC accuracy.
Average is 0.015%/hr. Genetics, liver health, and tolerance shift this between 0.010–0.020%/hr.
Log each drink as you go for the most accurate live curve.
Modeled absorption & elimination curve for your full session.
0 / 8 glasses
Water helps prevent dehydration and eases next-day symptoms, but it does not lower your BAC or speed up alcohol metabolism. Only time does that.
General effects by approximate BAC level. Individual response varies significantly.
| BAC | Typical Effects |
|---|
Method
Pick your calculation model, log what you actually drank, and set your region. Everything else updates on its own.
01
Weight, sex, and optionally height or body fat percentage, so you can choose Classic Widmark, Watson body-water, or the body fat model.
02
Add each drink with its own type, size, and time, not one lump total. Mark whether you ate, since food changes absorption speed.
03
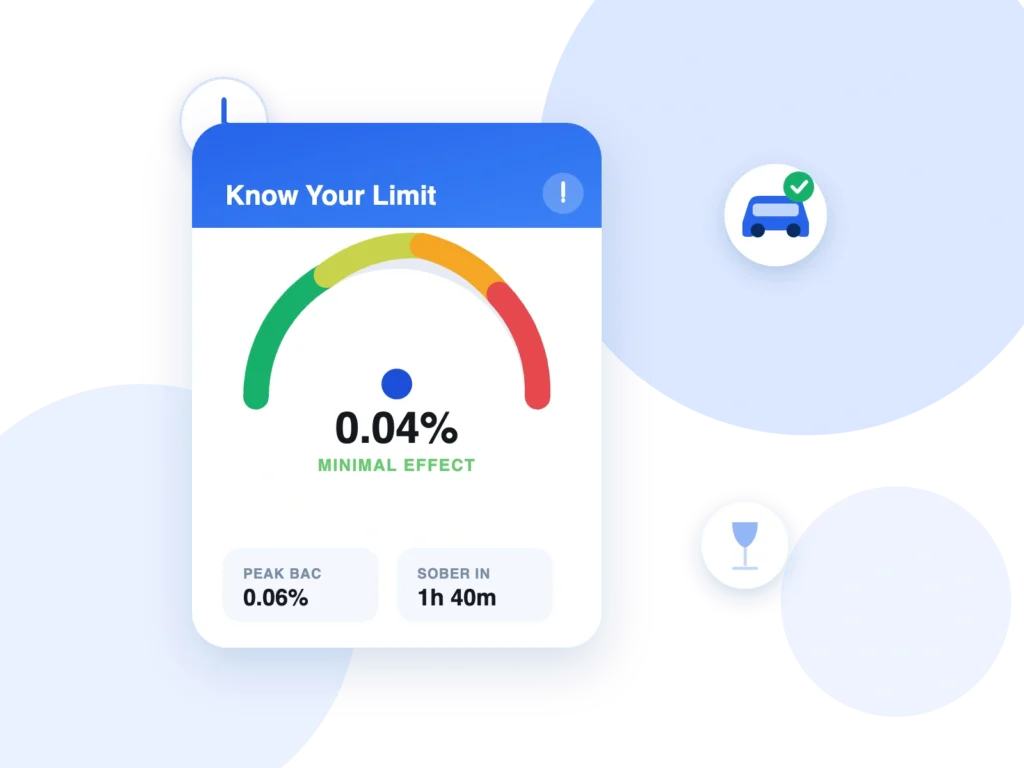
See your live BAC, your peak, and the exact time you’ll be under your selected legal limit or fully back to zero.
HOW WE CALCULATE
Unlike most tools online that run one basic formula, this calculator gives you a choice of three calculation models, so the estimate can match how precise you want it to be.
The standard formula most calculators and health resources use, based on weight and biological sex.
A more refined model that estimates body water percentage more accurately, generally a better fit for most adults.
Uses your actual lean mass versus fat mass. Alcohol distributes through body water, not fat, so this gives the tightest estimate.
Every drink logged with its own type, size, ABV, and time, not one lump total.
Roughly 45 minutes absorption fasted versus around 90 minutes fed.
Adjustable between 0.010% and 0.020% per hour instead of one fixed average.
A full pharmacokinetic simulation across your session, not a single after-the-fact number.
YOUR JURISDICTION
Most BAC calculators show a flat 0.08% and call it done. The real legal limit depends on where you are and who’s driving, so this calculator lets you select the exact reference that applies to your situation.
US Standard driver (21+)
US Commercial driver
US Under-21
UK and most of the EU
Zero tolerance countries
Once selected, your result is compared directly against that number, and the countdown, chart, and status badge all update to match. No cross-referencing a separate chart yourself. Whether you’re looking for a general blood alcohol estimate or specifically checking a DUI BAC calculator style result against your local driving limit, this same tool covers both.
WHILE YOU WAIT
Once you log your drinks, this blood alcohol tracker keeps working in the background.
Recalculated automatically every 30 seconds.
Know the highest point your level is expected to reach.
Counting down as time passes, tied to your selected jurisdiction.
A running estimate of when you'll reach 0.00%.
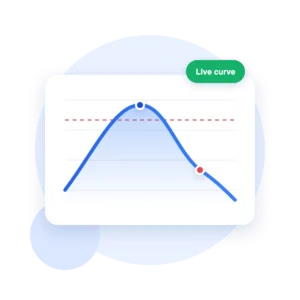
The rise and fall of your blood alcohol content across the session, with your legal limit marked as a reference line and each drink marked at the time logged.
When your estimated BAC crosses your selected legal limit, the result includes a direct next step, how long to wait, or a reminder to arrange a ride, not just a colored badge left for you to interpret.
TIME, NOT TRICKS
There’s no shortcut. Coffee, cold showers, and food will not make your liver clear alcohol any faster. The only thing that lowers BAC is time, roughly 0.015% per hour on average, though this calculator lets advanced users adjust that rate if they want a more personalized estimate. If your BAC is 0.08%, expect somewhere around five to six hours before you’re back to fully sober. Rather than relying on that rough rule of thumb, this calculator gives you a specific countdown based on your actual drinks, your chosen model, and your elimination rate.
Your results
Session summary, BAC chart, drink timeline, and the assumptions used, formatted and ready to save.
One click copies a plain-text version of your result to your clipboard.
A clean, simple snapshot of your BAC and status, easy to send in a message.
BEYOND THE DRINKS
Because of this, treat every result as a solid estimate, not a certified measurement, and give yourself real buffer room, especially close to your legal limit.
HONEST EXPECTATIONS
Even with three calculation models, a food toggle, and an adjustable elimination rate, this is still an estimate, not a lab test. Studies on Widmark-based formulas show results can be off by 15 to 20% compared to an actual breath or blood test. If you genuinely need a certified reading for legal or medical reasons, only a calibrated breathalyzer or a blood test administered by a professional gives you that.
QUESTIONS
Yes. Select US Standard, US Commercial, US Under-21, UK/EU, or Zero Tolerance from the legal limit reference, and every part of your result, the countdown, the chart, and the status badge, updates to compare against that specific number.
It depends on your weight, sex, and how quickly you’re drinking. Log your actual drinks in the timeline for a number based on your real session rather than a rough average.
Food eaten before or during drinking can lower your peak BAC by slowing absorption, which is why this calculator has a dedicated food toggle. Coffee and water do nothing to speed up how fast your liver clears alcohol that’s already in your blood.
Classic Widmark is the standard formula most calculators use. Watson Body-Water is a refinement that’s generally more accurate for most adults. Body Fat Percentage is the most precise, since it accounts for your actual lean-to-fat ratio rather than an average.
Yes. An advanced elimination rate slider lets you fine-tune this between 0.010% and 0.020% per hour, instead of relying on the fixed population average that most calculators use.
Roughly 0.015% BAC clears per hour on average. A BAC of 0.08% takes about five to six hours to reach zero. This calculator gives you a specific countdown based on your own session and settings.
No. This tool is for education and awareness only. It’s not a certified device and shouldn’t be the deciding factor in whether you drive. If you’ve been drinking, the safest choice is not to.
Your session, including your profile, drink log, and settings, is saved locally on your own device so nothing is lost on refresh. Nothing is sent to or stored on any server.
Yes. Download a full PDF report for your records, copy a plain-text summary, or generate a shareable result card to send directly from your phone.